What India’s 2026–27 Defence Budget Really Tells Us: A Look Under the Hood
The 2026–27 defence budget lifts spending to a new high, but is the rise reflective of post-conflict correction rather than clear structural transformation and sustained multi-year acceleration?

Budget day produces numbers, and each year those numbers are accompanied by a wave of positive commentary across media channels. This post looks beyond headline percentages to examine constant-price trends, inflation stress cases, exchange-rate exposure, and BE–RE dynamics. The budget represents a real upward correction, consistent with India’s post-crisis and kinetic-operation pattern. Whether it marks a structural change depends on persistence across future budgets.
The 2026–27 defence budget has been described as a strong post-Sindoor correction, shaped by the broader Ladakh, Line of Control, and maritime posture in the 2020–26 period. Capital outlay has risen. Revenue allocations have increased. Operational expenditure is presented more transparently in several heads. All of that signals intent. But intent and capability are not the same thing.
To understand what this budget actually represents, I chose to dive a little deeper and to look under the hood.
The Baseline: Real Capital in Constant Prices
The first step I took was to remove general inflation and examine capital outlay in constant prices. Using a rebased GDP deflator (constant 2001–02 prices), the long-term capital trend looks like this:
Chart 1
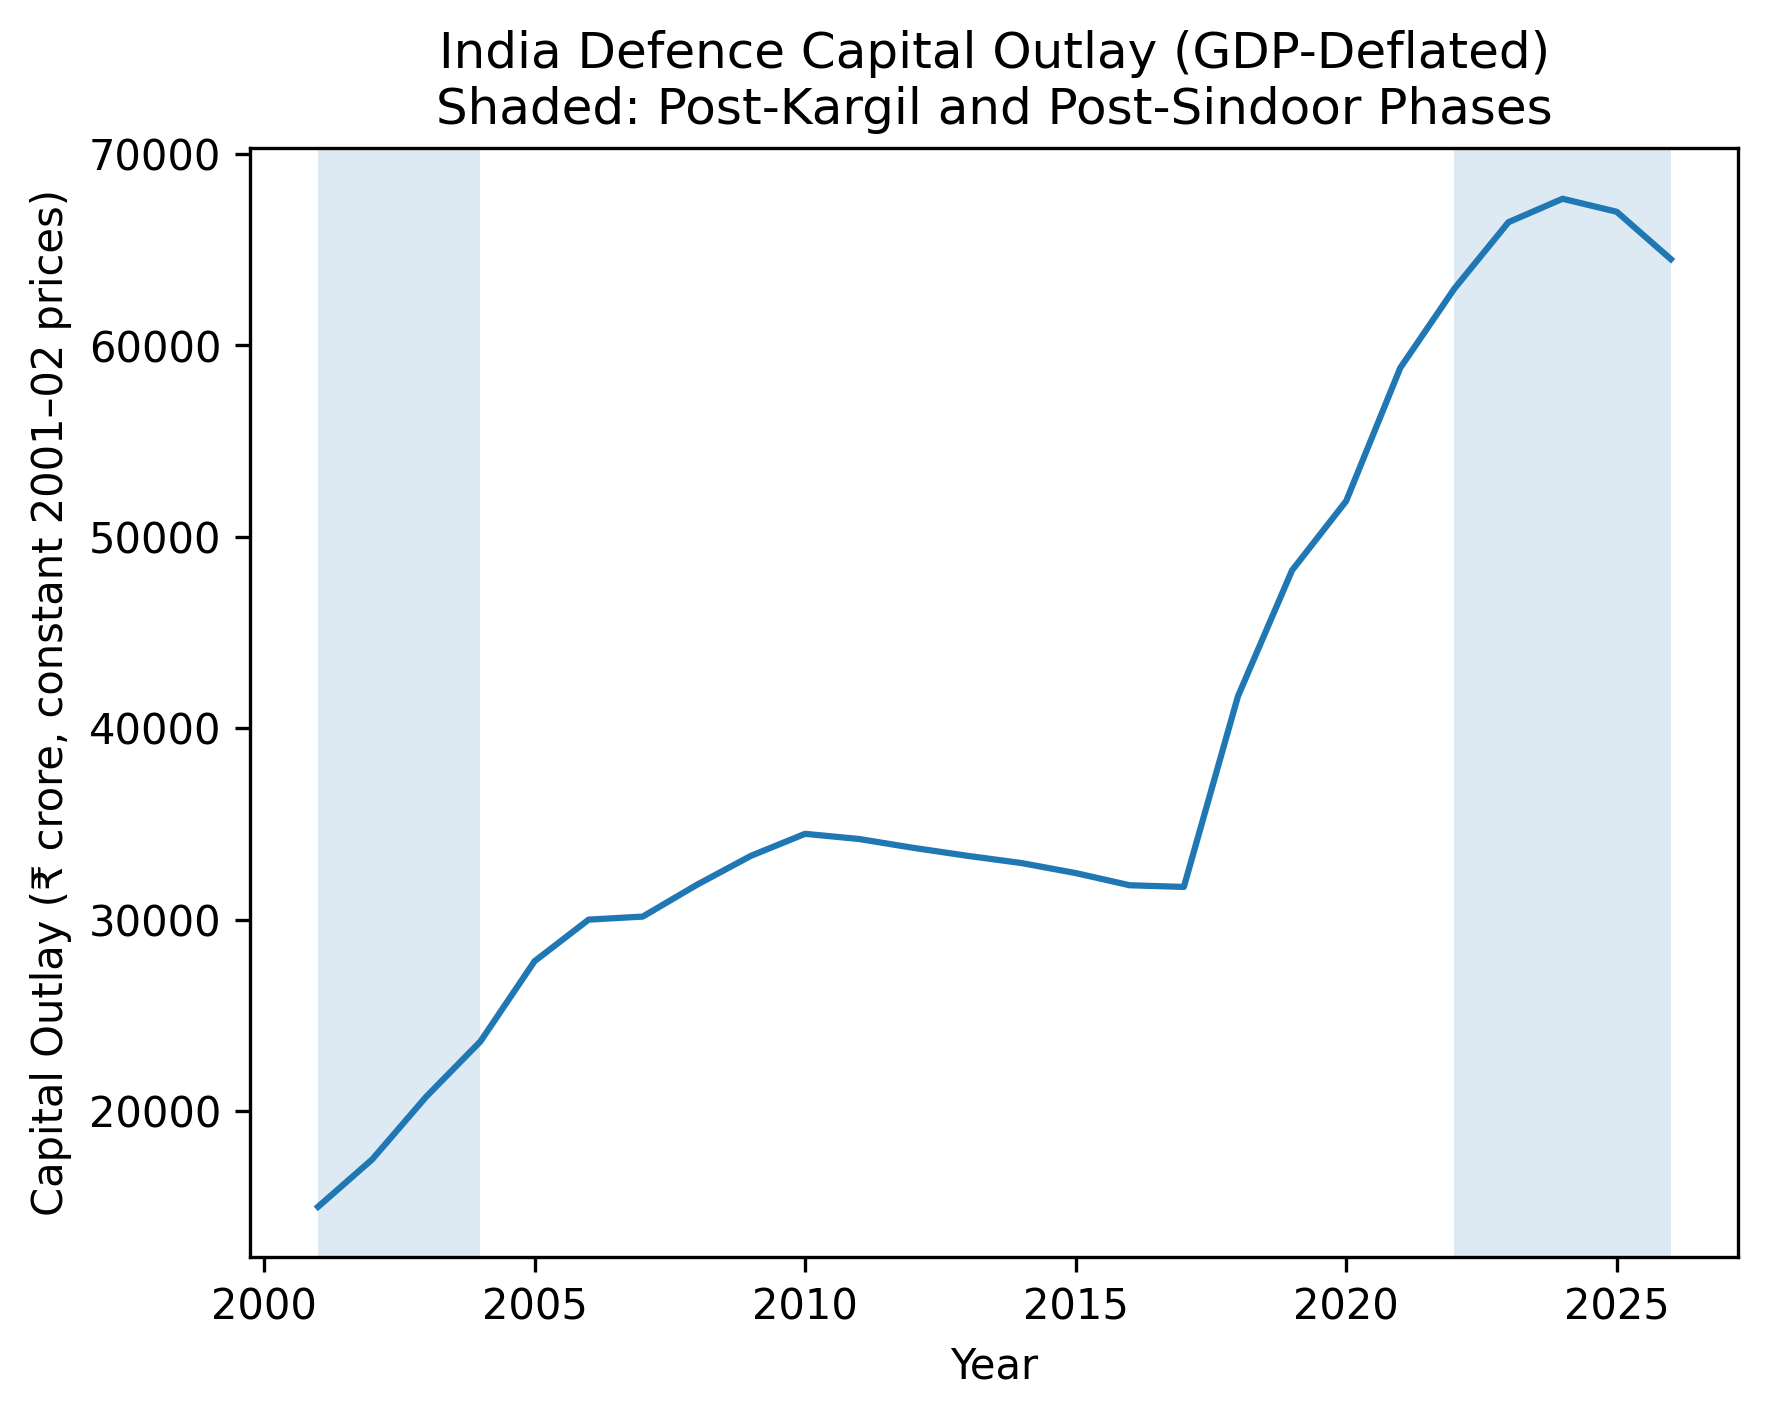
Two features stand out. India’s defence capital spending rises in jumps, not in a steady climb. After major conflicts and crises, spending moves up and then settles into a flatter phase rather than continuing to accelerate. The shaded bands mark the periods following Kargil and Operation Sindoor. In both cases, outlays increased and then stabilised at a higher level.
The 2026–27 allocation lifts the level once more. Raising the baseline is not the same as steepening the trajectory.
Since 2016, the trajectory does trend upward. Yet the rise comes in discrete adjustments and consolidations, not in a steady, compounding climb. The distinction matters for assessing whether we are seeing correction or transformation.
Take a closer look at the chart from 2014.
Chart 2
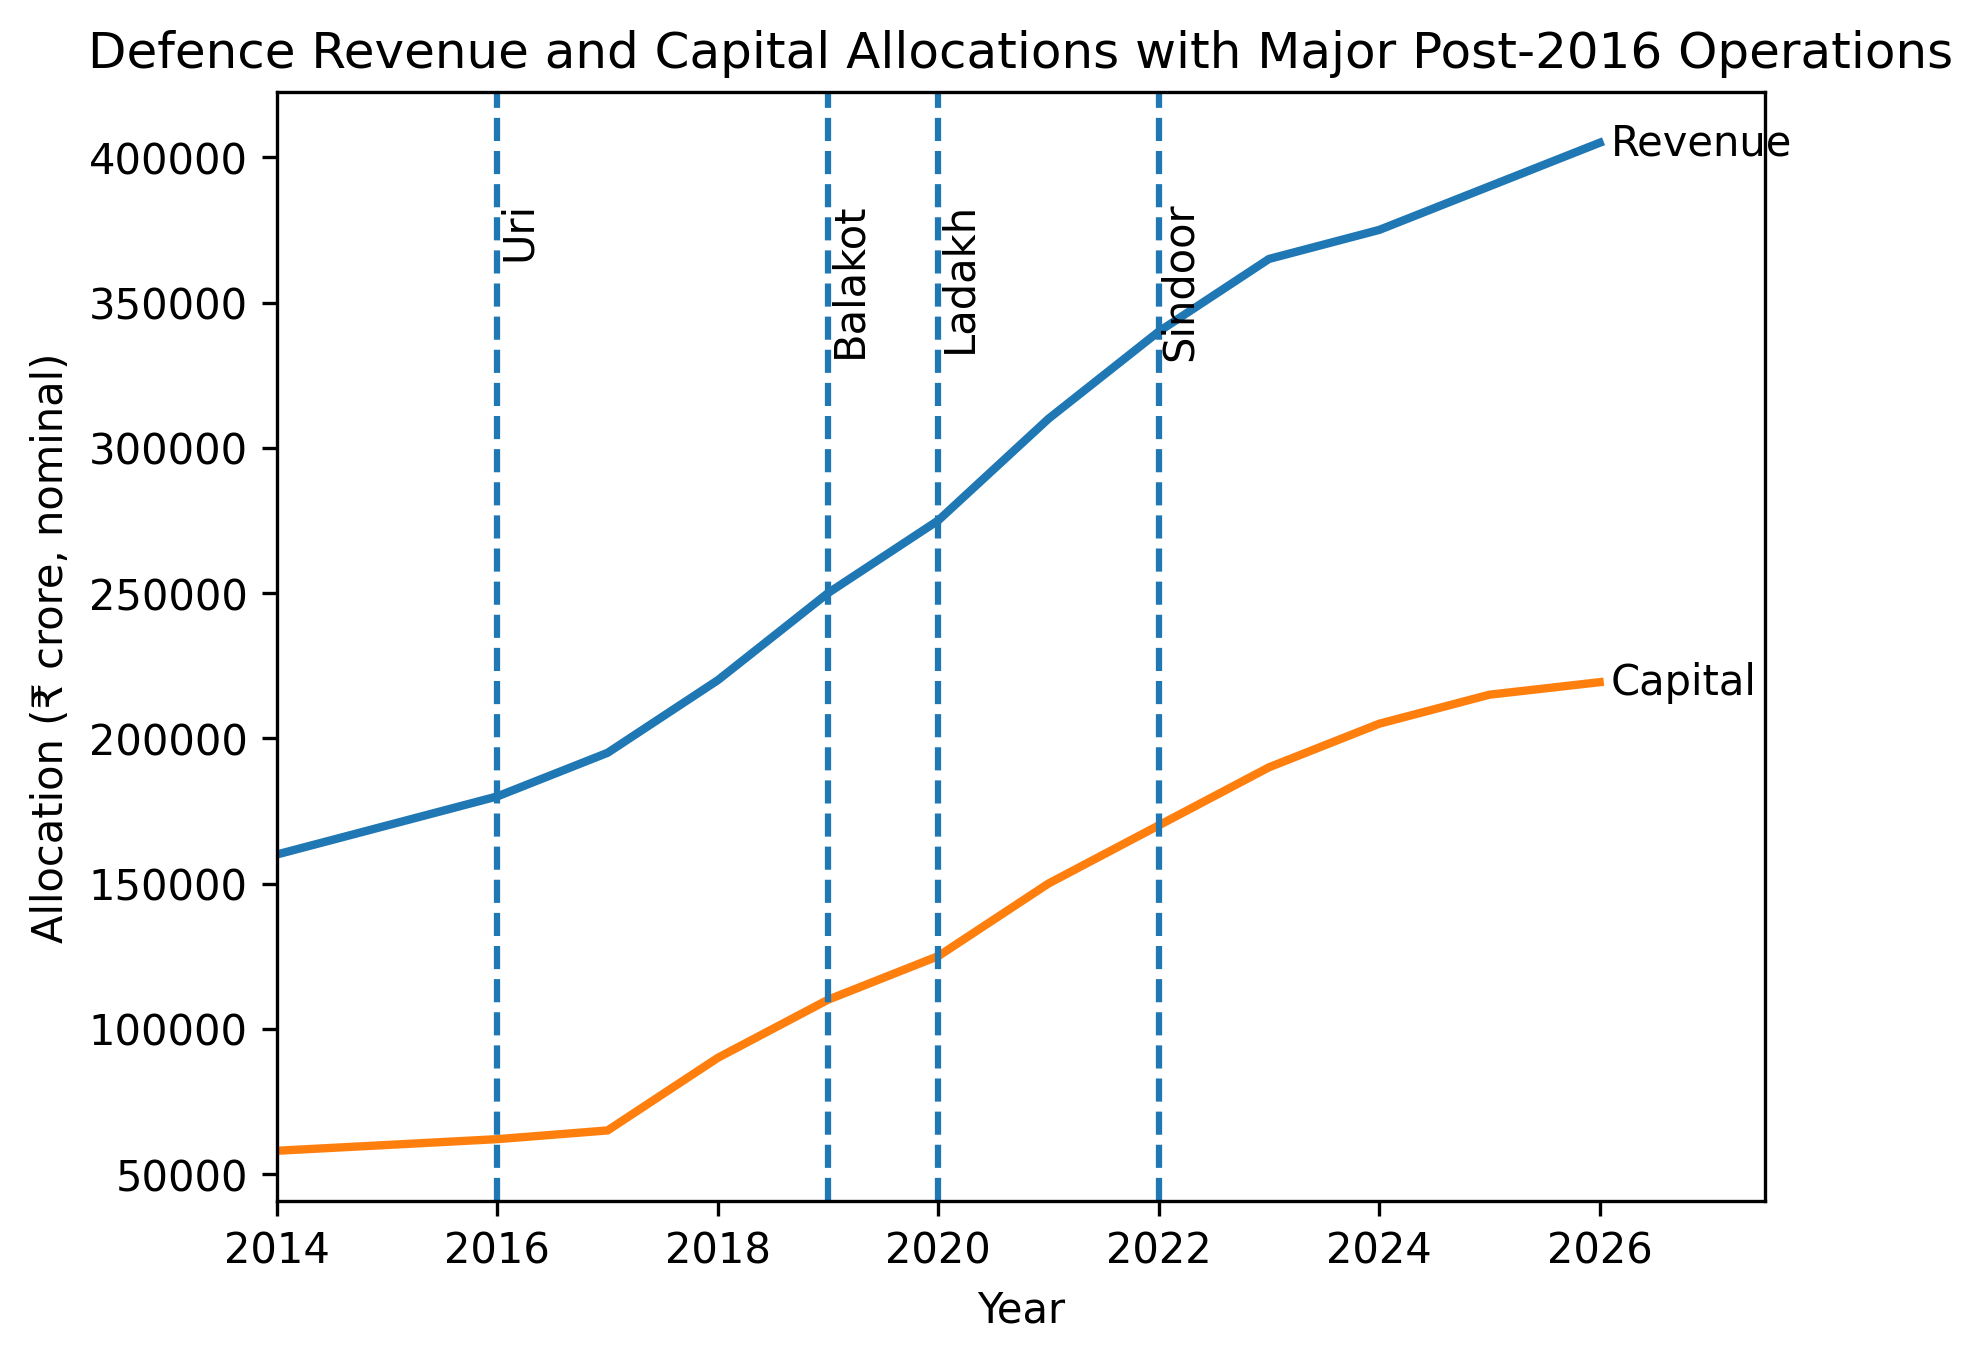
The chart shows that post-2016 increases are not confined to capital modernisation alone. Revenue allocations rise sharply alongside capital, especially after major operational shocks such as Uri, Balakot, the Ladakh crisis, and Operation Sindoor. This reflects the reality that sustained deployments, high-altitude posture, ammunition replenishment, logistics and maintenance impose recurring costs that sit in the revenue head.
Capital spending responds to operational pressure through accelerated acquisitions and infrastructure upgrades. But revenue growth is often steeper because operational commitments generate immediate and continuing expenditure. The widening gap between the two lines underscores an important structural feature of India’s defence budgeting: crisis response is not just about buying new platforms; it is about sustaining force readiness over time.
Taken together, the post-2016 trend suggests that recent budget increases combine operational correction with modernisation efforts. Distinguishing between temporary surge and durable structural shift will depend on whether capital growth persists and whether revenue pressures stabilise once immediate operational demands ease.
Inflation Sensitivity: What If Defence Costs Rise Faster?
GDP deflation assumes defence prices track general inflation. They do not. Defence platforms are technology-intensive, produced in small volumes/runs, subject to specialised supply chains, and import-dependent.
To test sensitivity, I modelled two alternative scenarios:
- Defence inflation = GDP inflation + 2 percentage points (central estimate)
- Defence inflation = GDP inflation + 3 percentage points (stress case)
These scenarios use the GDP deflator as the base and then add a defence-specific wedge of +2 and +3 percentage points.
Chart 3
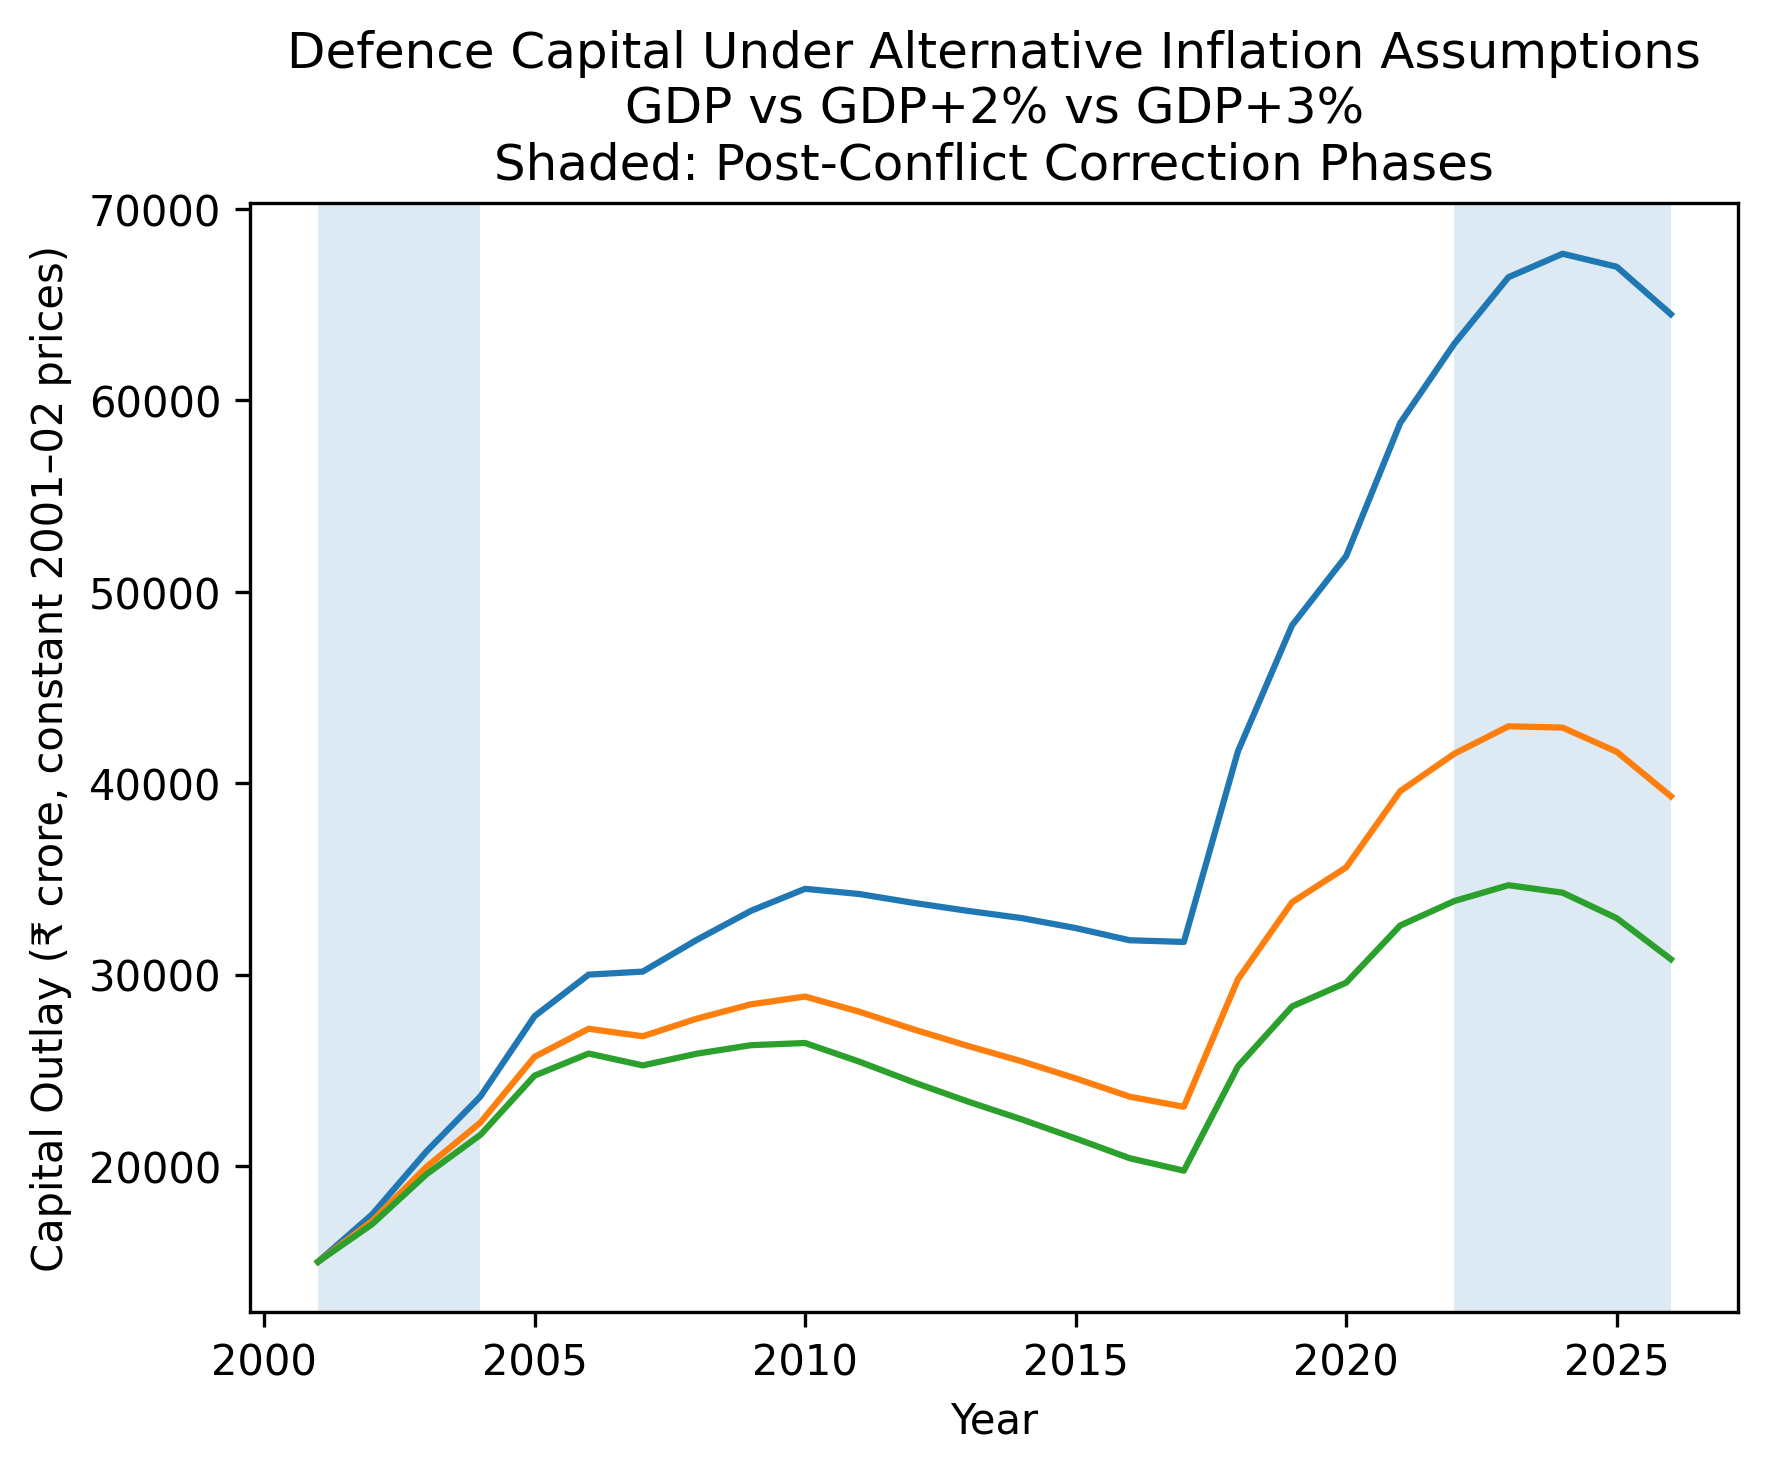
The divergence widens over time because small annual wedges compound. Under a +2% assumption, the plateau phases flatten meaningfully. Under +3%, long-run growth moderates even further.
For India, +3% is likely an upper-bound stress case over the medium term, given rising indigenous content. But the exercise shows how sensitive the long-term modernisation story is to relatively modest inflation differentials.
The lesson is not that growth disappears. The point is that part of ‘real’ growth may simply preserve purchasing power rather than expand capability.
External Buying Power: The Forex Channel
Inflation is not the only pressure. A substantial portion of India’s capital procurement still has foreign technology exposure — engines, sensors, electronics, subsystems. Rupee depreciation erodes buying power for these components.
To approximate this effect, I constructed an import-adjusted series assuming roughly 50% of capital expenditure is FX-sensitive and adjusted for cumulative rupee depreciation. The 50% share is a simplifying, order-of-magnitude assumption, not a statement of current contract-level exposure.
Chart 4
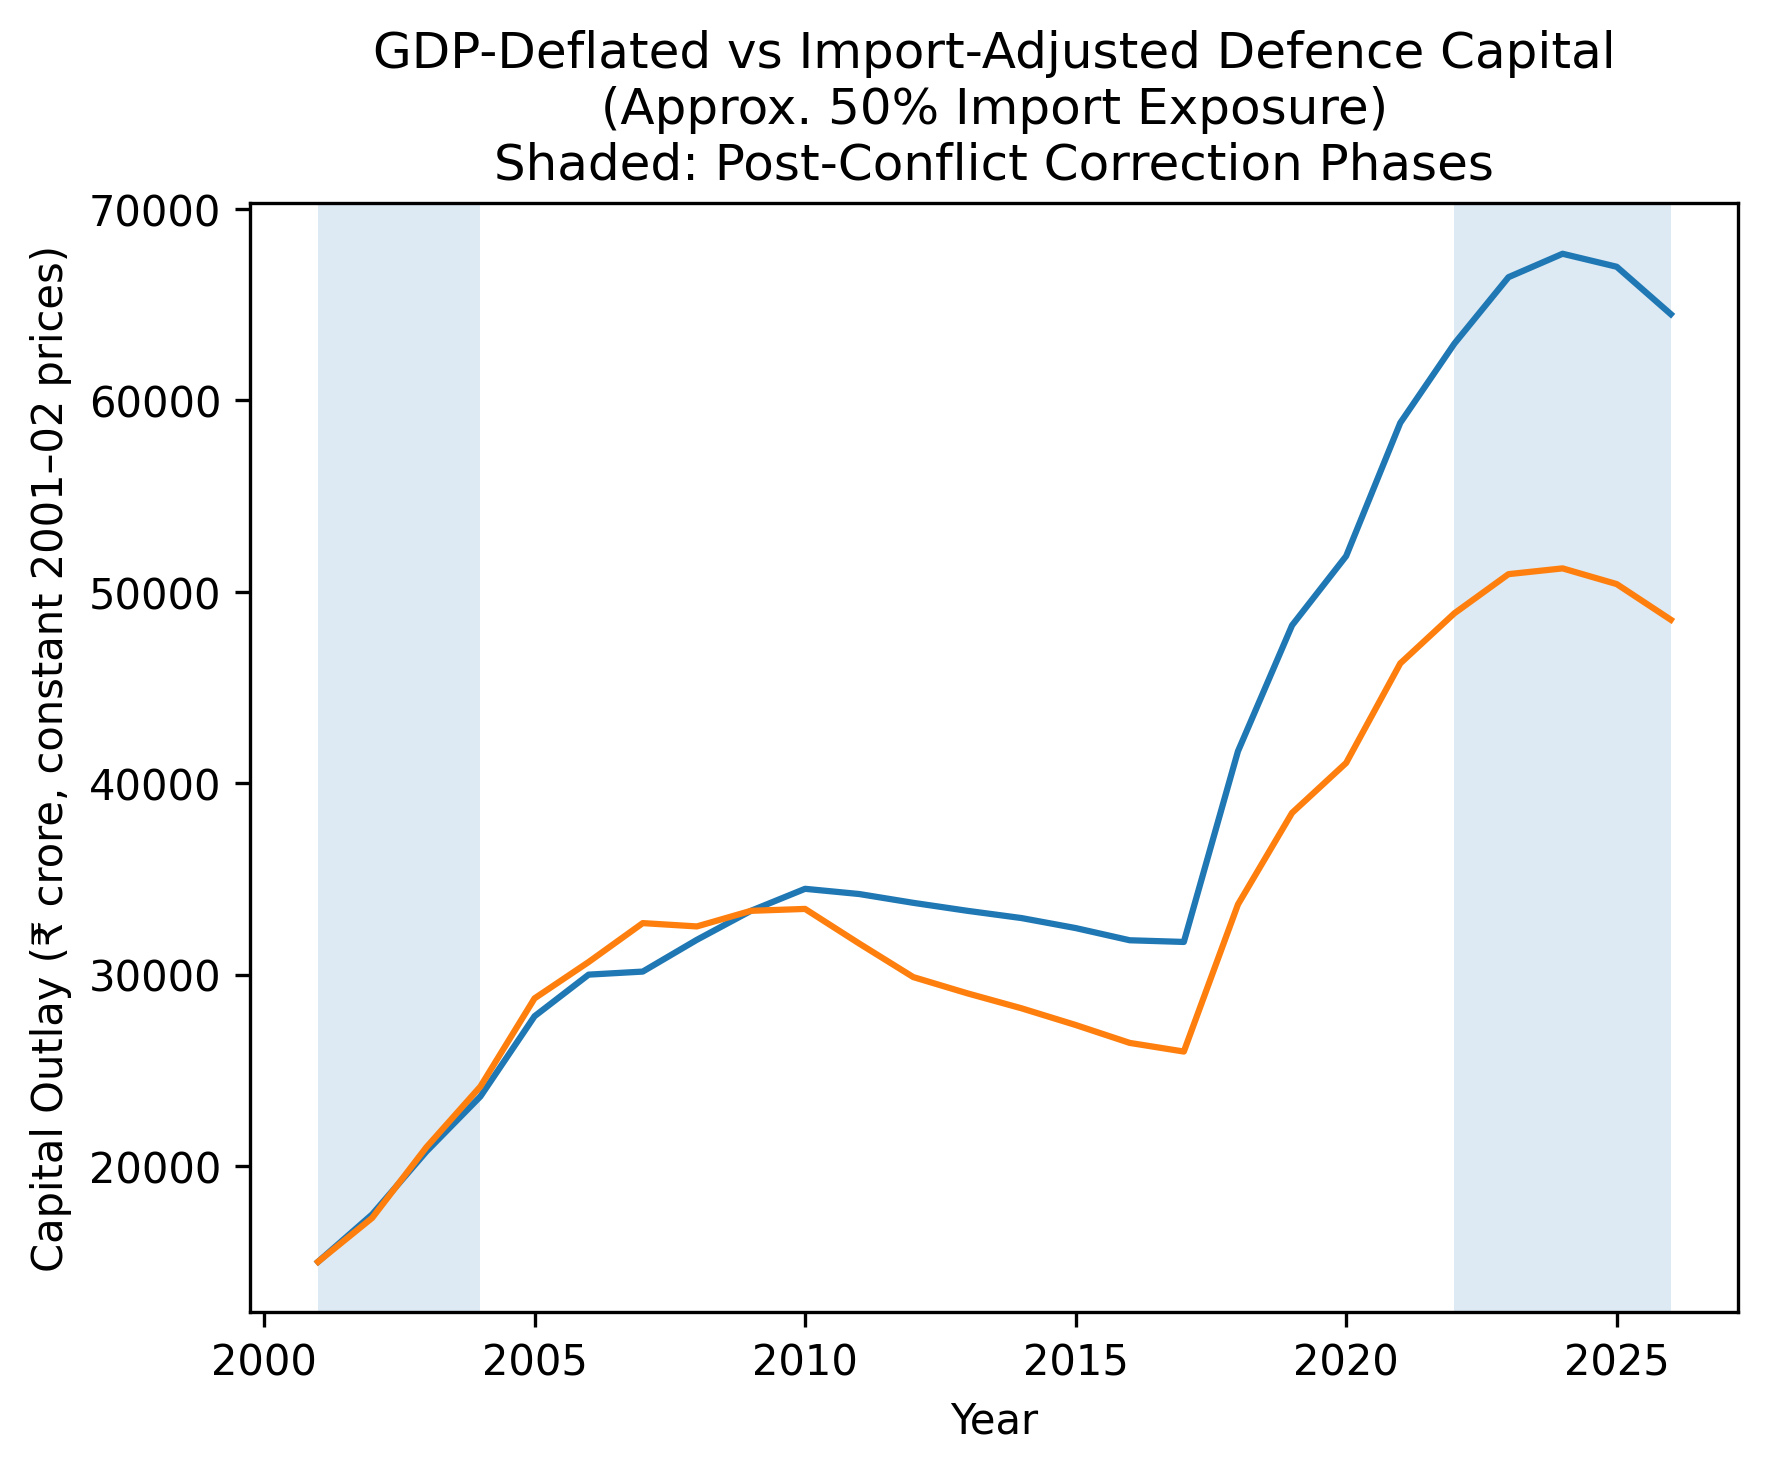
The gap between the GDP-deflated line and the import-adjusted line represents erosion in external purchasing power. The gap widens over time. This does not negate the rise in budgetary effort.
It shows that effective expansion in externally sourced capability grows more slowly than nominal or GDP-deflated figures suggest.
Inflation and Forex: A Rafale Sensitivity Illustration
The 36-aircraft Rafale deal signed in 2016 was widely reported at roughly €7.87 billion. At an exchange rate of about ₹74 per euro, this translated to approximately ₹58,000 crore.
Now assume — purely for illustration — that the same euro-denominated basket is scaled proportionally to 114 aircraft, without changing configuration, technology content, or lifecycle structure. That implies a notional value of about €24.9 billion.
1: Foreign Exchange Only
If the exchange rate remained at ₹74 per euro, the rupee cost would be about ₹1.84 lakh crore.
If the rupee moved to ₹90 per euro, the cost rises to roughly ₹2.24 lakh crore.
That is an increase of nearly ₹40,000 crore, purely from currency movement — without acquiring a single additional aircraft.
2: With Modest Inflation
The actual Rafale contract has its own escalation formula and caps; this illustration abstracts from those details to isolate compounding effects. Assume euro-denominated costs escalate at a conservative 2 percent per year. Even a modest 2 percent annual increase compounds to roughly 22 percent over ten years — because each year builds on the previous one.
That means the euro cost rises by about 22 percent, even before exchange-rate effects.
When you combine a 22 percent euro cost increase with a 22 percent rupee depreciation, the total impact is close to a 50 percent rise in the rupee bill. The rupee bill rises by roughly 49 percent, without any change in capability.
This is not a forecast of future Rafale pricing. It is a sensitivity illustration.
It shows how import-heavy capital programmes are exposed to two compounding pressures: contract escalation and currency movement. Nominal increases are necessary — but real purchasing power depends on how inflation and forex dynamics interact over time.
Note: A forthcoming post will examine what the Rafale acquisition implies for the AMCA programme and India’s long-term aerospace strategy.
BE vs RE: The Base Had Already Shifted
One distinction often lost in headline commentary is the difference between Budget Estimates (BE) and Revised Estimates (RE).
The BE is the government’s planned spending at the start of the financial year. The RE reflects the government’s adjustment to that number during the year, once actual operational and contractual pressures become clear. In effect, BE shows intent. RE shows how reality intervened.
In 2025–26, total defence BE was ₹6,81,210 crore. By the RE stage, this had already been revised upward to ₹7,32,512 crore — a significant mid-year adjustment. The year was marked by heightened operational commitments, including those associated with Operation Sindoor and the wider operational posture. The upward revision indicates that the fiscal base had already shifted before the new budget cycle began. The 2026–27 BE now stands at ₹7,84,678 crore.
If we compare BE 2025–26 to BE 2026–27, we see the headline increase of 15.19 percent. But if we compare RE 2025–26 to BE 2026–27, the increase is closer to 7 percent. That is a more meaningful comparison, because it measures next year’s plan against the most recent adjusted spending level rather than against the original, lower baseline.
The same pattern appears in capital acquisition, the core of modernisation. Capital (Acquisition) was ₹1,61,528 crore in BE 2025–26, revised upward to ₹1,67,779 crore at the RE stage, and now stands at ₹1,79,299 crore in BE 2026–27. The increase is real. But part of it reflects consolidation at an already elevated base rather than a sudden structural surge.
This does not diminish the significance of the 2026–27 allocation. It simply means the story is one of reinforcement at a higher level, not a break from a historically suppressed baseline.
So What Is This Budget?
This budget raises the level, reflects responsiveness to the post-2020–26 operational cycle and Op Sindoor, and improves transparency in operational classification. But whether it marks a lasting structural acceleration remains to be seen.
India’s defence spending history suggests step-ups followed by plateaus. The budgets over the next few years will tell us which path 2026–27 represents.
The Core Insight
Taken together, the charts show that nominal increases are necessary and real increases are better, but effective capability growth depends on how inflation, exchange rates, operational commitments, and institutional absorption interact over time. Outlays signal priority; strategic effect depends on persistence, institutional absorption, and force integration.
What Would Structural Transformation Look Like?
A genuine structural break in India’s defence modernisation trajectory would look different from a post-conflict correction.
It would involve:
- Sustained real increases across several consecutive budgets
- Smoother execution, with fewer large BE-to-RE adjustments
- Broad-based absorption across the Army, Navy and Air Force
- Capital growth that consistently outpaces defence-specific inflation
It would also be accompanied by institutional reform in planning, contracting, and joint capability development, so that higher outlays translate into integrated force capability.
One strong year signals correction. Several strong, sustained years signal transformation.
The 2026–27 defence budget raises the baseline and signals seriousness in a more demanding security environment, and that in itself matters. But budgets acquire meaning over time, not in isolation. The real test lies ahead: whether this higher level is sustained, whether execution stabilises, and whether capital allocations translate into durable force integration and readiness. If the next few budgets reinforce the trend rather than merely defend it, we may indeed be witnessing the early stages of structural change. If not, this will stand as another necessary but temporary correction in India’s long modernisation arc.
Method Note:
Constant-price values are constructed using a rebased GDP deflator. Alternative defence-inflation scenarios (GDP+2% and GDP+3%) are presented as modelling envelopes. The import-adjusted illustration assumes partial foreign-exchange exposure to approximate external purchasing-power effects. Charts were generated using publicly available data and AI-assisted computation; assumptions and interpretations are the author’s, and all modelling choices are deliberately conservative.